Smart Permutational Multivariate Analysis of Variance
Source:R/smart_permanova.R
smart_permanova.RdComputes Permutational Multivariate Analysis of Variance (PERMANOVA) for testing differences in group location using multivariate data. Variance partitioning computed on a sample-by-sample triangular matrix obtained from variable-by-sample data following Anderson (2001). Calculates a range of inter-sample distances, similarities and dissimilarities. Includes control for genetic drift for bi-allelic genetic markers such as single nucleotide polymorphisms (SNP) following Patterson, Price and Reich (2006) that can be combined with SMART Principal Component Analysis (PCA). Optimized to run fast matrix building and permutations for big datasets in ecological, evolutionary and genomic research.
Arguments
| snp_data | File name read from working directory.
SNP = rows, samples = columns without row names or column headings.
SNP values must be count data (no decimals allowed).
File extension detected automatically whether text or |
|---|---|
| packed_data | Logical value for |
| sample_group | Character or numeric vector assigning samples to groups. Coerced to factor. |
| sample_remove | Logical |
| snp_remove | Logical |
| missing_value | Number |
| missing_impute | String handling missing values.
Default |
| scaling | String. Default |
| sample_distance | Type of inter-sample proximity computed (distance, similarity, dissimilarity).
Default is |
| program_distance | A string value indicating R package to estimate proximities between pairs of samples.
Default |
| target_space | String.
Default |
| pc_axes | Number of PCA axes computed always starting with PCA axis 1. Default |
| pairwise | Logical.
Default |
| pairwise_method | String specifying type of correction for multiple testing.
Default |
| permutation_n | Number of permutations resulting in PERMANOVA test p value.
Default |
| permutation_seed | Number fixing random generator of permutations.
Default |
Value
Returns a list containing the following elements:
permanova.samplesDataframe showing sample summary. Column Group assigns samples to tested groups. Column Class specifies if samples were used in, or removed from, testing.
permanova.global_testList showing table with degrees of freedom, sum of squares, mean sum of squares, F statistic, variance explained (R2) and p value.
permanova.pairwise_testList showing table F statistic, variance explained (R2), p value and corrected p value per pair of groups. Obtained only if
pairwise = TRUE.permanova.pairwise_correctionString indicating type of correction for multiple testing.
permanova.permutation_numberNumber of permutations applied to obtain the distribution of p value.
permanova.permutation_seedNumber fixing random generator of permutations for reproducibility of results.
Details
PERMANOVA is a form of linear modelling that partitions variation in a triangular matrix of inter-sample proximities obtained from variable-by-sample data.
Uses permutations to estimate the probability of observed group differences in SNP composition given a null hypothesis of no differences between groups (Anderson 2001).
Proximity between samples can be any type of distance, similarity or dissimilarity.
Original acronym NPMANOVA (Non-Parametric MANOVA) replaced with PERMANOVA (Anderson 2004, 2017).
Univariate ANOVA captures differences in mean and variance referred to as location and dispersion in PERMANOVA's multivariate context (Anderson & Walsh 2013, Warton, Wright and Wang 2012).
To attribute group differences to location (position of sample groups) and/or dispersion (spread of sample groups), PERMANOVA must be combined with PERMDISP as implemented through smart_permdisp.
Function smart_permanova uses adonis to fit formula snp_eucli ~ sample_group, where snp_eucli is the sample-by-sample triangular matrix in Principal Coordinate Analysis (Gower 1966) space.
Current version restricted to one-way designs (one categorical predictor) though PERMANOVA can handle >1 crossed and/or nested factors (Anderson 2001) and continuous predictors (McArdle & Anderson 2001).
If >2 sample groups tested, pairwise = TRUE allows pairwise testing and correction for multiple testing by holm (Holm) [default], hochberg (Hochberg), hommel (Hommel), bonferroni (Bonferroni), BY (Benjamini-Yekuieli), BH (Benjamini-Hochberg) or fdr (False Discovery Rate).
For big data, Dist builds sample-by-sample triangular matrix much faster than vegdist.
Dist computes proximities euclidean, manhattan, canberra1, canberra2, minimum, maximum, minkowski, bhattacharyya, hellinger, kullback_leibler and jensen_shannon. vegdist computes manhattan, euclidean, canberra, clark, bray, kulczynski, jaccard, gower, altGower, morisita, horn, mountford, raup, binomial, chao, cao and mahalanobis.
Euclidean distance required for SMARTPCA scaling.
sample_remove should include both samples removed from PCA and ancient samples projected onto PCA space (if any).
Data read from working directory with SNPs as rows and samples as columns.
Two alternative formats: (1) text file of SNPs by samples (file extension and column separators recognized automatically) read using fread; or (2) duet of EIGENSTRAT files (see https://reich.hms.harvard.edu/software) using vroom_fwf, including a genotype file of SNPs by samples (*.geno), and a sample file (*.ind) containing three vectors assigning individual samples to unique user-predefined groups (populations), sexes (or other user-defined descriptor) and alphanumeric identifiers.
For EIGENSTRAT, vector sample_group assigns samples to groups retrievable from column 3 of file *.ind.
SNPs with zero variance removed prior to SVD to optimize computation time and avoid undefined values if scaling = "sd" or "drift".
Users can select subsets of samples or SNPs by introducing a vector including column numbers for samples (sample_remove) and/or row numbers for SNPs (snp_remove) to be removed from computations.
Function stops if the final number of SNPs is 1 or 2.
EIGENSOFT was conceived for the analysis of human genes and its SMARTPCA suite so accepts 22 (autosomal) chromosomes by default.
If >22 chromosomes are provided and the internal parameter numchrom is not set to the target number chromosomes of interest, SMARTPCA automatically subsets chromosomes 1 to 22.
In contrast, smart_permanova accepts any number of autosomes with or without the sex chromosomes from an EIGENSTRAT file.
References
Anderson, M. J. (2001) A new method for non-parametric multivariate analysis of variance. Austral Ecology, 26, 32-46.
Anderson, M. J. (2004). PERMANOVA_2factor: a FORTRAN computer program for permutational multivariate analysis of variance (for any two-factor ANOVA design) using permutation tests (Department of Statistics, University of Auckland, New Zealand).
Anderson, M. J. & D. C. I. Walsh (2013) PERMANOVA, ANOSIM, and the Mantel test in the face of heterogeneous dispersions: What null hypothesis are you testing? Ecological Monographs, 83, 557-574.
Gower, J. C. (1966) Some distance properties of latent root and vector methods used in multivariate analysis. Biometrika, 53, 325-338.
McArdle, B. H. & M. J. Anderson (2001) Fitting multivariate models to community data: a comment on distance-based redundancy analysis. Ecology, 82, 290-297.
Patterson, N., A. L. Price and D. Reich (2006) Population structure and eigenanalysis. PLoS Genetics, 2, e190.
Warton, D. I., S. T. Wright and Y. Wang (2012) Distance-based multivariate analyses confound location and dispersion effects. Methods in Ecology and Evolution, 3, 89-101.
See also
adonis (package vegan),
Dist (package Rfast),
fread (package data.table),
vegdist (package vegan),
vroom_fwf (package vroom)
Examples
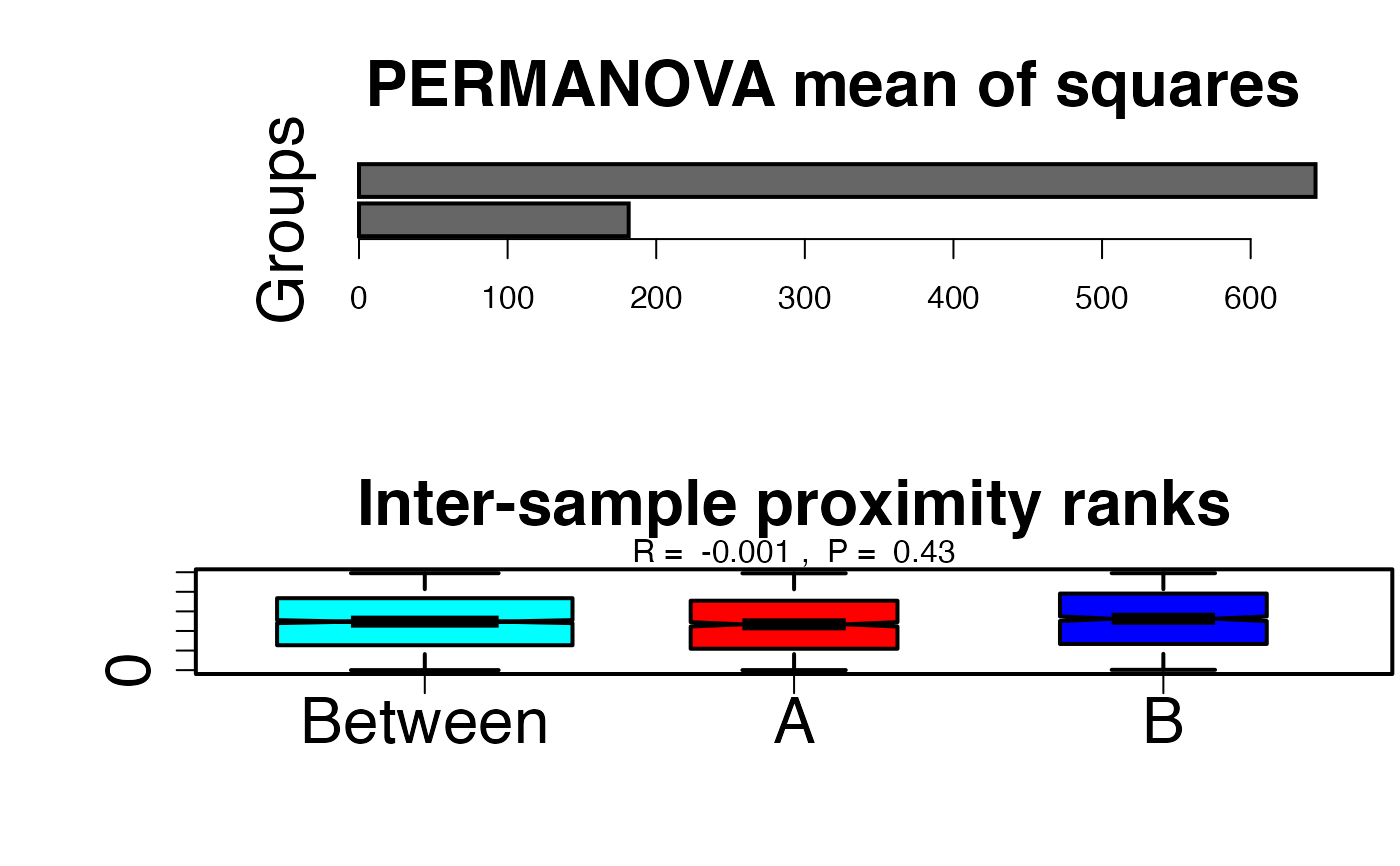
# Path to example genotype matrix "dataSNP" pathToGenoFile = system.file("extdata", "dataSNP", package = "smartsnp") # Assign 50 samples to each of two groups my_groups <- as.factor(c(rep("A", 50), rep("B", 50))) # Run PERMANOVA permanovaR <- smart_permanova(snp_data = pathToGenoFile, sample_group = my_groups)#>#>#>#>#>#>#>#>#>#>#>#>#>#>#>#>#>#>#>#>#>#>#>#>#>#>#>#>#>#># Extract summary table assigning samples to groups permanovaR$permanova.samples#> Group Class #> 1 A PERMANOVA #> 2 A PERMANOVA #> 3 A PERMANOVA #> 4 A PERMANOVA #> 5 A PERMANOVA #> 6 A PERMANOVA #> 7 A PERMANOVA #> 8 A PERMANOVA #> 9 A PERMANOVA #> 10 A PERMANOVA #> 11 A PERMANOVA #> 12 A PERMANOVA #> 13 A PERMANOVA #> 14 A PERMANOVA #> 15 A PERMANOVA #> 16 A PERMANOVA #> 17 A PERMANOVA #> 18 A PERMANOVA #> 19 A PERMANOVA #> 20 A PERMANOVA #> 21 A PERMANOVA #> 22 A PERMANOVA #> 23 A PERMANOVA #> 24 A PERMANOVA #> 25 A PERMANOVA #> 26 A PERMANOVA #> 27 A PERMANOVA #> 28 A PERMANOVA #> 29 A PERMANOVA #> 30 A PERMANOVA #> 31 A PERMANOVA #> 32 A PERMANOVA #> 33 A PERMANOVA #> 34 A PERMANOVA #> 35 A PERMANOVA #> 36 A PERMANOVA #> 37 A PERMANOVA #> 38 A PERMANOVA #> 39 A PERMANOVA #> 40 A PERMANOVA #> 41 A PERMANOVA #> 42 A PERMANOVA #> 43 A PERMANOVA #> 44 A PERMANOVA #> 45 A PERMANOVA #> 46 A PERMANOVA #> 47 A PERMANOVA #> 48 A PERMANOVA #> 49 A PERMANOVA #> 50 A PERMANOVA #> 51 B PERMANOVA #> 52 B PERMANOVA #> 53 B PERMANOVA #> 54 B PERMANOVA #> 55 B PERMANOVA #> 56 B PERMANOVA #> 57 B PERMANOVA #> 58 B PERMANOVA #> 59 B PERMANOVA #> 60 B PERMANOVA #> 61 B PERMANOVA #> 62 B PERMANOVA #> 63 B PERMANOVA #> 64 B PERMANOVA #> 65 B PERMANOVA #> 66 B PERMANOVA #> 67 B PERMANOVA #> 68 B PERMANOVA #> 69 B PERMANOVA #> 70 B PERMANOVA #> 71 B PERMANOVA #> 72 B PERMANOVA #> 73 B PERMANOVA #> 74 B PERMANOVA #> 75 B PERMANOVA #> 76 B PERMANOVA #> 77 B PERMANOVA #> 78 B PERMANOVA #> 79 B PERMANOVA #> 80 B PERMANOVA #> 81 B PERMANOVA #> 82 B PERMANOVA #> 83 B PERMANOVA #> 84 B PERMANOVA #> 85 B PERMANOVA #> 86 B PERMANOVA #> 87 B PERMANOVA #> 88 B PERMANOVA #> 89 B PERMANOVA #> 90 B PERMANOVA #> 91 B PERMANOVA #> 92 B PERMANOVA #> 93 B PERMANOVA #> 94 B PERMANOVA #> 95 B PERMANOVA #> 96 B PERMANOVA #> 97 B PERMANOVA #> 98 B PERMANOVA #> 99 B PERMANOVA #> 100 B PERMANOVA# Extract PERMANOVA table permanovaR$permanova.global_test#> Df SumsOfSqs MeanSqs F.Model R2 Pr(>F) #> group 1 26183 26183 0.9858 0.00996 0.8463 #> Residuals 98 2602901 26560 0.99004 #> Total 99 2629084 1.00000# Plot means of squares per group #run pca with truncated SVD (PCA 1 x PCA 2) pcaR1 <- smart_pca(snp_data = pathToGenoFile, sample_group = my_groups)#>#>#>#>#>#>#>#>#>#>#>#>#>#>#>#>#>#>#>#>#>#>#>#>#>#>#>#>#>#>#>#>#compute Euclidean inter-sample distances in PCA space (triangular matrix) snp_eucli <- vegan::vegdist(pcaR1$pca.sample_coordinates[,c("PC1","PC2")], method = "euclidean") #run PERMANOVA permanova <- vegan::adonis(formula = snp_eucli ~ my_groups, permutations = 9999) #extract meanSqs (groups versus residuals) meanSqs <- as.matrix(t(permanova$aov.tab$MeanSqs[1:2])) colnames(meanSqs) <- c("Groups", "Residuals") #two horizontal plots oldpar <- par(mfrow = c(2,1), oma = c(0,5,0.1,0.1), lwd = 2) barplot(meanSqs, horiz = TRUE, main = "PERMANOVA mean of squares", cex.names = 2, cex.main = 2, col = c("grey40")) #run ANOSIM anosimD <- vegan::anosim(snp_eucli, my_groups, permutations = 999) #remove outputs for clean plotting #anosimD[2] <- ""; anosimD[5] <- "" par(mar = c(5, 0.1, 3.5, 0.1)) plot(anosimD, xlab = "", ylab = "distance/similarity ranks", main = "Inter-sample proximity ranks", cex.main =2, cex.axis = 2, col = c("cyan", "red", "blue"))