Overview
The package smartsnp runs fast and user-friendly computation of Principal Component Analysis (PCA) on single-nucleotide-polymorphism (SNP) data suitable for ancient, low-coverage and modern DNA. The package combines SNP scaling for genetic drift and projection of ancient samples onto a modern genetic PCA space (currently available only in Unix environment in the field-standard software EIGENSOFT) with permutation-based multivariate tests for population differences in genetic diversity (both location and dispersion). The package comprises three functions that run each analysis individually (smart_pca, smart_permanova, smart_permdisp), and a wrapper function (smart_mva) that runs any combination of the three standalone functions.
Installation
Install the released version of smartsnp from CRAN with:
install.packages("smartsnp")Install the latest development version from GitHub:
if (!require("devtools")) {
  install.packages("devtools")
}
devtools::install_github("ChristianHuber/smartsnp")
Vignettes
The vignettes demonstrate the different steps of a typical smartsnp analysis.
All vignettes and function descriptions can be found at the smartsnp website:
Quick example
This is an example of how to run PCA, PERMANOVA and PERMDISP controlling for genetic drift for the package’s dataset dataSNP including 10000 simulated SNPs in 100 samples (80 = modern, 20 = ancient).
#1/ Load package and label samples
library(smartsnp)
# Path to example genotype matrix "dataSNP"
pathToGenoFile = system.file("extdata", "dataSNP", package = "smartsnp")
#assign 50 samples to each of two groups
my_groups <- c(rep("A", 50), rep("B", 50))
#assign samples 1st to 10th per group to ancient
my_ancient <- c(1:10, 51:60)
#2/ Run PCA with truncated SVD (PCA 1 x PCA 2 axes) and assign results to object pcaR
pcaR <- smart_pca(snp_data = pathToGenoFile, sample_group = my_groups, sample_project = my_ancient)
#assign statistical results to objects pcaR_eigen, pcaR_load and pcaR_coord
pcaR_eigen <- pcaR$pca.eigenvalues; dim(pcaR_eigen) # extract eigenvalues
#> [1] 3 2
pcaR_load <- pcaR$pca.snp_loadings; dim(pcaR_load) # extract principal coefficients (SNP loadings)
#> [1] 4532 2
pcaR_coord <- pcaR$pca.sample_coordinates; dim(pcaR_coord) # extract principal components (sample position in PCA space)
#> [1] 100 4
#3/ Run PERMANOVA test (group location in PCA1 x PCA2 space after excluding ancient samples) and assign results to object permanovaR
permanovaR <- smart_permanova(snp_data = pathToGenoFile, sample_group = my_groups, target_space = "pca", sample_remove = my_ancient)
#assign sample summary to object permP
permP <- permanovaR$permanova.samples
#show PERMANOVA table
permanovaR$permanova.global_test
#> Df SumsOfSqs MeanSqs F.Model R2 Pr(>F)
#> group 1 175.8 175.82 0.45613 0.00581 0.6459
#> Residuals 78 30066.3 385.47 0.99419
#> Total 79 30242.1 1.00000
#4/ Run PERMDISP test (group dispersion in PCA1 x PCA2 space after excluding ancient samples) and assign results to object permdispR
permdispR <- smart_permdisp(snp_data = pathToGenoFile, sample_group = my_groups, sample_remove = my_ancient)
#assign sample summary to object permD
permD <-permdispR$permdisp.samples
#show PERMDISP table
permdispR$permdisp.global_test
#> Df Sum Sq Mean Sq F Pr(>F)
#> Groups 1 0.07254468 0.07254468 0.1911168 0.6693
#> Residuals 78 29.60747071 0.37958296 NA NA
#5/ Run PCA, PERMANOVA and PERMDISP in one run and assign results to object mvaR
mvaR <- smart_mva(snp_data = pathToGenoFile, sample_group = my_groups, sample_remove = my_ancient)
# assign statistical results to objects mvaR_eigen, mvaR_load and mvaR_coord
mvaR_eigen <- mvaR$pca$pca.eigenvalues # extract PCA eigenvalues
mvaR_load <- mvaR$pca$pca.snp_loadings # extract principal coefficients (SNP loadings)
mvaR_coord <- mvaR$pca$pca.sample_coordinates # extract PCA principal components (sample position in PCA space)
#show PERMANOVA table
mvaR$test$permanova.global_test
#> Df SumsOfSqs MeanSqs F.Model R2 Pr(>F)
#> group 1 11849 11849 0.97217 0.01231 0.9092
#> Residuals 78 950644 12188 0.98769
#> Total 79 962493 1.00000
#show PERMDISP table
mvaR$test$permdisp.global_test # extract PERMDISP table
#> Df Sum Sq Mean Sq F Pr(>F)
#> Groups 1 0.07254468 0.07254468 0.1911168 0.6661
#> Residuals 78 29.60747071 0.37958296 NA NA
#assign sample summary to object mvaS
mvaS <- mvaR$test$test_samples
#NOTE 1: Modify argument pc_axes to set the number of computed PCA axes (defaults: pc_axes = 2, program_svd = "RSpectra")
#use program_svd = "bootSVD" for computing all PCA axes, where pc_axes has no effect on computations
#NOTE 2: Missing values in dataset can only be coded as 9 (default: missing_value = 9) or NA (missing_value = NA)
#SNPs with missing values are removed by default (missing_impute = "remove")
#use missing_impute = "mean" for imputing missing values with SNP means
#NOTE 3: arguments sample_remove and snp_remove remove any set of samples (by column number) and SNPs (by row number), respectively
#defaults: sample_remove = FALSE, snp_remove = FALSE
#NOTE 4: use argument sample_project to specify ancient samples by row number (default: sample_project = FALSE)
#ancient samples are assumed to include missing values
#if specified, ancient samples are always removed from PCA, PERMANOVA and PERMDISP computations
#use argument pc_project to set the PCA space onto which ancient samples are projected (default: pc_project = c(1:2) for PCA 1 x PCA2 space)
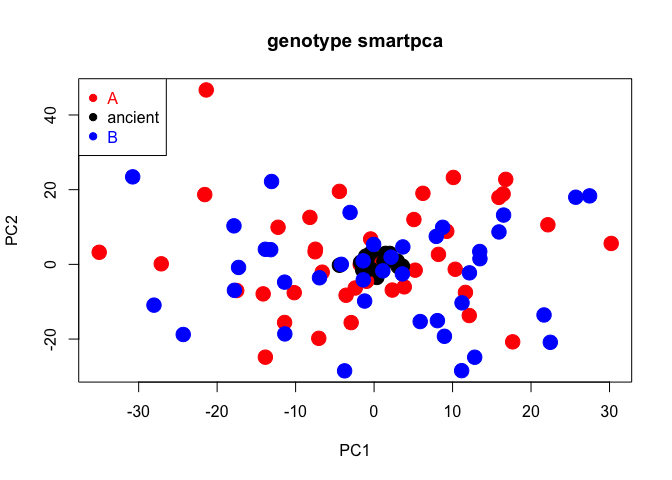
#6/ Plot PCA 1 x PCA 2
#create colors for samples groups
cols <- c("red", "blue")
#create color vector (group A = red, group B = blue, ancient samples = black)
my_groups[my_ancient] <- "ancient"; cols = c("red", "black", "blue")
#plot
plot(pcaR$pca.sample_coordinates[,c("PC1","PC2")], cex = 2, col = cols[as.factor(my_groups)], pch = 19, main = "genotype smartpca")
legend("topleft", legend = levels(as.factor(my_groups)), cex = 1, pch = 19, col = cols, text.col = cols)